


Capacity
3000
Avg. Attendance
0
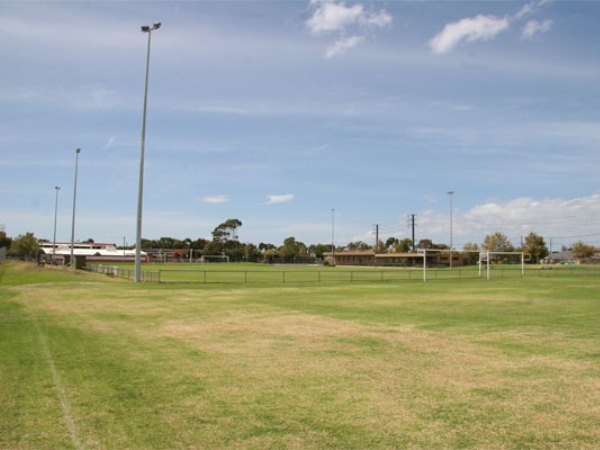
Stadium
Jack Smith Park (Adelaide)
Surface
grass
League stats
Matches
played
| Avarage per game | ALL | Last 5 | diff % |
|---|---|---|---|
| PPG | 0.60 | 0.00 | 0% |
| Goals scored | 0.9 | 0.6 | -33% |
| Goals conceded | 2.2 | 2.6 | +18% |
Over 1.5
82%
18/22 times
Over 2.5
64%
14/22 times
Over 3.5
32%
7/22 times
BTTS
46%
10/22 times
CARDS
2.6
Ø
Corners
10.5
Ø
Team form
|
HT |
Shots |
Shots (on goal) |
Danger attack |
Corners |
Lineup Changes |
1 | X | 2 | |||||
|---|---|---|---|---|---|---|---|---|---|---|---|---|---|
| 05/30/24 | 
|
West Torrens Birkalla
|
3 - 1 |
|
2-1 | 10 - 10 | 4 - 3 | 46 - 75 | 0 - 6 |
0 (0%) 0 (0%) |
-143 | 375 | 225 |
| 05/25/24 |
|
West Adelaide
|
0 - 5 |
|
0-2 | 8 - 11 | 4 - 6 | 46 - 56 | 6 - 5 |
0 (0%) 0 (0%) |
115 | 250 | 170 |
| 05/18/24 |
|
Vipers
|
4 - 2 |
|
2-2 | 14 - 11 | 8 - 9 | 40 - 48 | 3 - 6 |
0 (0%) 0 (0%) |
175 | 290 | 105 |
| 05/10/24 |
|
West Torrens Birkalla
|
1 - 0 |
|
0-0 | 9 - 10 | 4 - 5 | 64 - 63 | 4 - 4 |
0 (0%) 0 (0%) |
125 | 275 | 160 |
| 05/04/24 |
|
Playford City Patriots
|
2 - 1 |
|
1-1 | 13 - 8 | 6 - 4 | 46 - 60 | 4 - 11 |
0 (0%) 0 (0%) |
-161 | 320 | 280 |
Player stats
Data not available
Team tactics
Data not available
Table
previous seasons
| PLD | W | D | L | GF | GA | PTS | # | ||
|---|---|---|---|---|---|---|---|---|---|
| South Australia State League 1 | 2024 | 13 | 8 | 1 | 4 | 27 | 17 | 25 | 2. |
| South Australia State League 1 | 2023 | 22 | 10 | 4 | 8 | 37 | 37 | 34 | 6. |
| Npl South Australian | 2022 | 22 | 3 | 4 | 15 | 24 | 47 | 13 | 12. |
| South Australia State League 1 | 2021 | 22 | 14 | 3 | 5 | 45 | 19 | 45 | 1. |
| South Australia State League 1 | 2020 | 0 | 0 | 0 | 0 | 0 | 0 | 0 | 8. |
Team squad
Data not available
Players transfers
Data not available